\documentclass[8pt,onecolumn,letterpaper]{article}
\usepackage[top=0.5in, bottom=0.5in, left=1.0in, right=1.0in]{geometry}
\setlength{\columnseprule}{0.25pt}
\usepackage[utf8x]{inputenc}
\usepackage{ucs}
\usepackage{amsmath}
\usepackage{amsfonts}
\usepackage{amssymb}
\usepackage{bm}

\setlength{\parindent}{0in}
\setlength\parskip{0.1in}
\linespread{1.25}

\usepackage{graphicx}
\usepackage{color}
\usepackage[colorlinks=true, pdfstartview=FitV, linkcolor=blue, citecolor=blue, urlcolor=blue]{hyperref}

%\usepackage{fancyhdr}
%\pagestyle{fancy}
%\renewcommand{\headrulewidth}{0.0pt}
%\fancyhead{}
%\fancyfoot[CF]{\thesection - \thepage}

\author{Quant Lego}
\title{This is an article template}

\begin{document}
\maketitle

\tableofcontents
\pagenumbering{roman}

\newpage
\pagenumbering{arabic}

\section{Introduction}

\section{Methods}

\section{Results}

\section{Discussions}

\section{Conclusions}

\end{document}
Monday, June 17, 2013
A latex template for writing an technical article
Southeast and Gulf Coast electricity markets

- Unlike regions with independent power grids, power in the Southern states is provided by integrated power companies. Each of these companies is linked to nearby grids and power can be traded between them. However, because these are still regulated markets, there is little opportunity to trade power within the service area of any of these companies.
- The Gulf Coast region is characterized by mild winters and prolonged hot summers. Long-lasting heat waves can start affecting the area inearly spring and may last until late October ==> Seasonal demand is quite different from the northern states --- demand is low most of the winter and peaks for an extended time in the Summer.
- From a precipitation perspective, the southeastern United States has a tropic climate.
- There is a wet season running from November to May, and a dry season running from June to October.
- There is substantial hydroelectrical generation in the Tennessee Valley area that is affected by this rainfall. During the period of high rainfall, the Tennessee Valley can export power to other parts of the Southeast, the Midwest, or the East Coast.
- Coal and natural gas are both marginal fuels for the area. There are ready supplies of both fuels locally --- the Gulf Coast is a major source of natural gas, and the Appalachian Mountains contain abundant coal deposits.
New England electricity market (ISO-NE)

- There is only a single trading hub in the New England region. The price at thsi hub are based on selected nodes around the Boston area.
- New England has to import fuel for almost all of its power generation requirements.
- The marginal fuel for the region is natural gas. The bulk of this supply comes from the U.S. Gulf Coast and eastern Canada.
- There are efforts to augment this supply by constructing liquefied natural gas terminals in Massachusetts.
- Most of the population in New England is in the southern part of the region: Connecticut and the area around the city of Boston, Massachusetts. In contrast, the northern part of the region is relatively unpopulated.
New York electricity market (NYISO)

- The New York power grid is self-contained in the state of New York.
- The southeastern part of this region the most heavily concentrated areas of demand for electricity in the country: New York City and Long Island.
- The region is characterized by the flow of low cost power from the northern and western sections of the state into the high demand regions surrounding New York City.
- Most of New York metropolitan area is located on islands ==> (1) there is limited ability to transfer power to those areas from other parts of the region; (2) high reliance on inefficient generators during periods of peak demand. ==> New York City area is one of the most expensive power market in the country.
- To assure reliable service, power plants in the New York metropolitan area are subject to much stricter rules and regulatory requirements than are common in other regions.
Midwest electricity market (MISO)
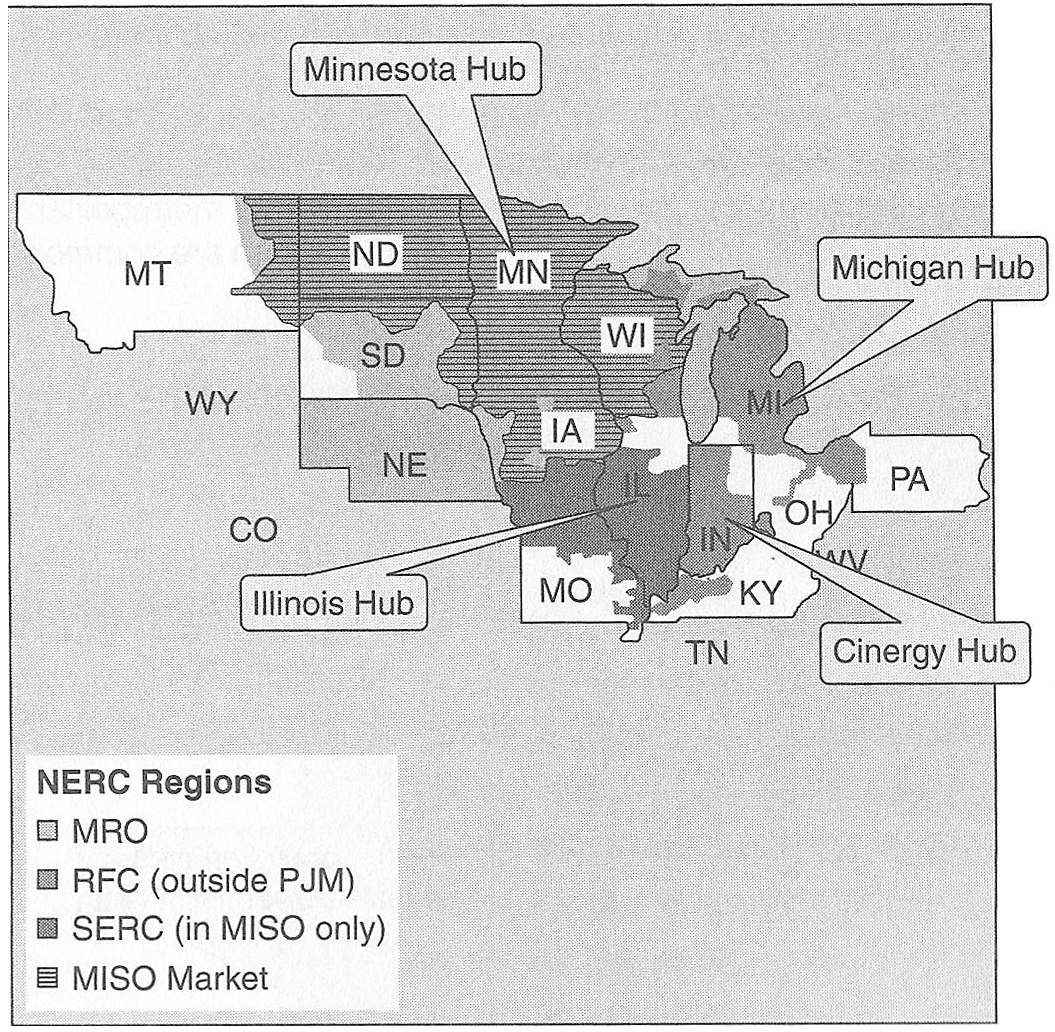
- The Midwest ISO coordinates power for the north-central United States
- The eastern part of the MISO region is heavily industrialized.
- The western section of th MISO region is more rural.
- There are several major trading locations in the region. among them Cinergy Hub is the most influential.
- From a climate perspective:
- The middle of the United States has cold winters and hot summers.
- The cold weather usually starts in December, but can arrive in early November and usually lasts through April.
- The summer months, July and August, are hot and humid, but the weather cools off quickly in September.
- Many of the power plants in the region, including a large number of marginal producers, are coal powered ==> Coal prices often dominate the price of power in the Midwest even in high demand periods. This is a unique feature of the area (In most of United States, the power price is set by natural-gas-fired plants).
- Power is often wheeled from the Midwest to adjacent regions when the price of natural gas spikes upward.
- Cool shoulder months (the spring and fall) in the Midwest ==> Power is often wheeled to southern states where hot weather is more common.
- Some hydroelectric power is available from the Great Lakes and Tennessee Valley areas. Depending on the time of the year, power may be imported from either of these two regions.
Mid-Atlantic electricity market (PJM ISO)

- The Mid-Atlantic region contains many large population centers, like Washington D.C., Baltimore, and Philadelphia, on the eastern seaboard.
- This area formed one of the first independent power grids, the PJM ISO, named after its condtituent states: Pennsylvania, New Jersey, and Maryland.PJM has since expanded to include West Virginia, Delaware, large parts of Ohio, parts on northern Illinois, and Virginia.
- It is one the largest and most liquid electricity markets. A number of active trading hubs are located within PJM.
- Geographically, the PJM service area is very diverse:
- Large reserves of coal native to Pennsylvania and West Virginia serve as the marginal fuel for western part of the PJM service area.
- Power on the East Coast and Virginia is commonly determined by gas-fired power plants.
- Climate:
- The climate in the northern half of the region ranges from cold winters to hot summers.
- The climate in the southern half of the region is warmer --- mild winters and extended hot summers.
- A large number of power plants in the less populated areas of the PJM service area export power into the more populated regions ==> the power lines between these areas are often congested.
Pacific northwest electricity market

- In most years, the Pacific Northwest sells surplus power into California and the Southwest.
- About two-thirds of all the electricity in this region comes from hydroelectric production ==> the quantity of surplus power depends heavily on precipitation ==> Water flow in this region directly affects the price of power in California.
- Melting snow from the Cascade Mountain range, which runs through central Washington and Oregon, is a major source of river water.
- To the west of the mountains are several major population centers: Seatle, Washington, and Portland, Oregon. The climate in these regions is fairly temperate all year.
- To the east of the mountains is the start of the northern plains state. This area is characterized by cold winters and hot summers.
- Mid Columbia (MIDC): is a delivery hub for a number of hydroelectric plants on the Columbia River.
- California-Oregon Border (COB): is a major switching station in southern Oregon, adjacent to the California border, that interconnects several major transmission lines.
Desert southwest electricity market

- The desert southwest has moderate winter and prolonged hot summers
- Mush of the year, the area has a surplus of generation capacity and is a major exporter of power to South California.
- Natural gas is the most common marginal fuel due to the abundant natural gas reserves, but coal and hydropower are relatively common too.
- The area also receives a great deal of sunlight, making it an attractive location for solar power.
- There are three major hubs for electricity trading in the area, and major power generation facilities are located near each hub.
- Mead: is located on the outskirts of Las Vegas. Lake Mead is the artificial lake formed when the Hoover Dam was built on the Colorado River. The Hoover Dam is a major source of hydroelectric power and the primary delivery point for power in southern Nevada.
- Palo Verde: is located at a major nuclear power plant and switching yard about 45 miles west of Phoenix, Arizona. Many high power lines to California are located at this switching yard.
- Four Corners: is located in northwestern New Mexico at the interconnection of several major transmission lines.
California electricity market (CAISO)

- California is a heavily populated state that is divided into two major zones: NP-15 and SP-15.
- Most of the year, the daily temperatures are moderate to warm. However, the dense population and hot summers can cause spikes in the electrical loads due to a demand for air conditioning.
- One of the major transmission lines, Path-15, bisects the state into two approximately equal parts and has given its name to the two major zones: NP-15 and SP-15.
- NP-15 (North Path 15)
- Covers the northern part of the state (San Francisco Bay area), north of Path 15.
- When rainfall or melting snow allows, this region imports low cost electricity from the Columbia River Basin in Oregon.
- For the remainder of the year, natural gas plants, supplied primarily from western Canada, set the price of power in NP-15.
- SP-15 (South Path 15)
- South of Path 15, the pricing zone for most of Southern California.
- A major importer of power from Arizona (natural gas and solar power) and Nevada (hydropower from the Colorado River).
- Natural-gas-fired plants in the south are fed from supplies in the rocky Mountain and West Texas regions.
- ZP-26
- A large but less important pricing zone that has a relatively low population and excess generation capacity.
- It connects to both the NP-15 and SP-15 zones.
Monday, May 13, 2013
Regional power markets in United States
There are three major integrated power grids in the United States:
Electrical prices vary regionally with an interconnection depending on regional population, industries, and weather conditions ==> Long distance transmission of power, called wheeling, between fundamentally different markets is the source of large number of trading opportunities.
Texas Interconnect
Read More
- Eastern Interconnect --- east of the Rocky Mountains
- Western Interconnect --- west of the Rocky Mountains
- Texas Interconnect --- Texas

Electrical prices vary regionally with an interconnection depending on regional population, industries, and weather conditions ==> Long distance transmission of power, called wheeling, between fundamentally different markets is the source of large number of trading opportunities.
Texas Interconnect
- Smallest interconnection in the United States.
- Entirely located within the state of Texas.
- Coordinated by a single ISO, the Electric Reliability Council of Texas (ERCOT).
- There are a number of DC power lines, of limited capacity, connecting the Texas power grid to the Eastern Interconnect and the Mexican power grids.

- The West Interconnect is a long line of regional grids stretching from the Pacific Northwest into the Desert Southwest, with California in the middle ==> Much of the trading in the Western Interconnect revolves around the flow of power into or out of the highly populated areas of California.
- The pacific Northwest (MIDC) and Colorado River (Mead) near las Vegas are major sources of hydroelectric power.
- 70% power supplies in Washington and Oregon come from hydroelectricity ==> small changes in water flow can result in substantial changes to regional power supply ==> Snow melts during Spring lead to more power supply than demand in Pacific Northwest, so some power is transmitted to areas of higher demand (usually California).
- California is a densely populated area: in summer it needs import of power from Pacific Northwest and Desert Southwest; in Fall mild temperature makes it possible to export power to still very hot areas of Las Vegas and Phoenix.
- The marginal power producers in California are usually natural-gas-fired plants ==> a steady supply of natural gas is required: southern California imports natural gas from the Rocky Mountains and West Texas, and northern California import natural gas from west Canada.

- It includes the two most important RTO/ISOs: PJM (originally named the Pensylvania, New jersey, and Maryland Interconnection) and MISO (Midwest ISO)
- The two most liquid trading locations in the Eastern Interconnect are Cinergy Hub (abbreviated MISO-Cin Hub) and PJM Western hub (PJM-W).
- Varieties in fuels and regional weather conditions provide many trading opportunities in the East Interconnect:
- Some important trades are between regions using col-fired plants and those using natural-gas-fired plants
- Other trades are weather related.
- The southern part of Eastern Interconnect has extended summer and mild winter, while the northern part has colder winter and shorter summer air-conditioning season.
Sunday, May 12, 2013
Heat rate and spark spreads
Heat rates
Read More
- Heat rate represent the efficiency of a power plant to convert fuel into electricity ==> Lower heat rate implies a more efficient power plant. \[\text{Heat Rate}=\frac{\text{Quantity of fuel used}}{\text{Quantity of power produced}}\]
- The unit of heat rate is Btu/KWh or MMBtu/MWh, with 1 MMBtu/MWh = 1000 Btu/KWh
- For example, heat rate of 8 MMBtu/MWh means a natural-gas-fired power plant will sell power profitably when the power price is 8 times of the natural gas price
- Market implied heat rate \[\text{Market implied heat rate}=\frac{\text{Power price}}{\text{Fuel price}}\] with the unit also being Btu/KWh or MMBtu/MWh.
- As a rule of thumb, natural gas power plants commonly have heat rates between 7 ~ 10 MMBtu/MWh.
- Heat rate extremely efficient
- Heat rate > 10 MMBtu/MWh ==> less efficient
- Spark spread is the theoretical profit that a natural-gas-fired power plant can make from buying fuel and selling power at current market prices, ignoring any charges for operational cost.
- Below tables shows an example of heat rates and spark spreads that are used by traders to approximate the behavior of electricity generators.
- Note: for coal-burning power generator, the corresponding spread is called dark spread.
Spark Spread = Power Price - (Gas Price × Heat Rate)

Design of electrical trading markets
Spot vs forward power markets
Read More
- The forward power market is where the bulk of speculative tradings occur, while the spot power market is where daily auctions occur.
- The forward market is open to anyone with sufficient money to meet trading requirements, while the spot market is open only to power providers with the ability to generate power and place it to the transmission grid.
- In forward market both physical contracts (requiring delivery of power) and financial contracts (settle in cash) are traded, while spot market involves only physical contracts.
- In spot market it is possible to buy spot power in arbitrary small sizes for immediate use anywhere in the country, while in the forward market it is only possible to trade large (month) blocks at a limited number (~20) of locations around the country.
- Trading power in large units at a limited number of locations has two consequences:
- Pro: it is easier to standardize contracts and find trading partners
- Con: trading prices at extended geographic areas around a major hub may not represent the exact price of power anywhere in the region ==> Power is often traded in two pieces: (1) standardized forward trades made at major hub to get the desired regional exposure approximately correct; (2) smaller fine-tuning trades to lock in an exact price at the specific location.

- Congestion charge: In periods of heavy demand, power lines can become overloaded ==> The primary way of rerouting power around congestion is to activate power plants close to the area of high demand even though their costs may not be low enough to enter winning bids of auction (out-of-merit-bid) ==> Under the FERC's Standard Market Design (SMD), the cost line congestion are paid by the affected parties (in a single location), rather than being shared by every user of the entire grid. Congestion costs aren't just paid by consumers, power producers pay them too. There is a charge for routing power into a high load area over congested power line, and a credit for producing power that bypasses the congestion.
- Line loss charge: Under the FERC's SMD, power produced only get paid for deliverable power, not on the gross power placed into a power grid.
- Locational Marginal Price (LMP) = clearing price (same everywhere in a power grid) + congestion charge (location specific) + Line loss charge (location specific) ==> Different prices are assigned to different locations in a power grid ==> location has become a major factor determining the profitability of a power plant, in addition to fuel cost and efficiency ==> There is economic incentive for power producers to relieve both line loss in transmission and line congestion ==> Power grid reliability increased significantly (compared with unregulated markets).
- There are three types of locations for calculating prices under SMD:
- Node prices: corresponds directly to the power price at an 'electrical bus', where power enters or leaves the transmission grid. Power generators are paid the nodal price of the electrical bus where they deliver power into the transmission grid.
- Zone price: is the average of all nodal prices within a limited geographical area. This is the price that customers pay for the power they receive.
- Hub price: is an average of selected nodal prices across several zones, and it serves as the benchmark price for a power grid ==> Hub prices are used extensively in forward market tradings. In most ISO/RTO regions, the clearing price for power and the hub price are synonymous.
- Financial Transmission Right (FTR)
- Here is a nice introduction about FTR.
- FTR is a financial instrument closely linked to Locational Marginal Price (LMP). It helps customers manage the price risk of having purchased or sold power at a major hub and then being forced to pay a different price when they deliver or receive power at a specific node.
- FTRs are tradable contracts made between two parties, which take opposite sides of an obligation to pay or receive the difference in price between two nodes. One party need to pay the other when there is a congestion.
- Sometimes FTRs can be structured as options, acting as insurance against adverse price change due to congestion.
- Trading products of power in terms of hours: weekdays x hours
- Peak: daytime hours, 7 am ~ 11 pm, examples are 5x16, 7x16
- Off-peak: nighttime hours, 11 pm ~ 7 am, examples are 5x8, 7x8
Overview of electricity markets
- It is hard to store electricity and expensive to transmit electricity over long distance ==> No unified national electricity market, instead just a collection of small regional markets with their own unique characteristics and regulations.In each market, supply and demand must constantly be matched, resulting in highly volatile prices.
- Regulations of regional markets
- Each regional is coordinated by its own Transmission Service Operator(TSO).
- In regulated markets, TSOs are government-sponsored monopolies
- In deregulated markets, TSOs are either Independent Service Operators (ISOs) or Regional Transmission Organizations (RTOs)
- ISOs are limited to doing services in a single state and are exempt from federal jurisdiction.
- RTOs are do business across several states and fall under federal jurisdiction.
- Some RTOs began in a single state as ISOs and became RTOs when they expanded across state boundaries, but they still keep ISO as part of their names.
- Deregulated markets use economic incentives to effect changes, while regulated markets use legislative mandates.
- In deregulated markets, the power price for a transmission grid is set by daily auctions
- Power producers submit the price at which they are willing to supply power, and are activated in order from the lowest to highest bid.
- All winning bidders get paid the same price regardless of their bids ==> non-discriminatory auctions
- The power price for every producer and every wholesale consumer is set to a single price ==> clearing price or wholesale price.
- Smaller customers pay a slightly higher power price ==> retail price
- The cost of bringing the last unit of electricity into the market is called the marginal price, and the most recently activated plant is the marginal producer ==> In deregulated markets, the clearing price is set by the marginal price of power.
- ISOs coordinate two types of auctions
- Day-ahead auction (DA)
- sets the power price for the following day in one-hour increments
- commonly completed in the early afternoon on the day before delivery ==> allows power producers have sufficient time to arrange fuel and operating schedules for the delivery day
- this auction is based on a prediction of next days' demands
- Real-time auction (RT)
- runs continuously throughout the actual delivery day
- balances the actual demand against the prediction of demand made in the previous day
- typically bid in five-minute increments
- Power plants participating in real-time auctions must have the capability of turning on and off quickly

Factors affecting natural gas prices
Natural gas prices are a function of market supply and demand. Because of limited alternatives for natural gas consumption or production in the short run, even small changes in supply or demand over a short period can result in large price movements to bring supply and demand back into balance. See Today in Energy, June 11, 2012 for recent examples.
Factors on the supply side that may affect prices include:
Factors on the demand side that may affect prices include:
Domestic Supply and Prices Can Be Cyclical
Most of the natural gas consumed in the United States comes from domestic production. U.S. production increased from 2006 through 2011, when it reached the highest recorded annual total since 1973. The increases in production were the result of more efficient, cost-effective drilling techniques, notably in the production of natural gas from shale formations.
Increased natural gas supply tends to dampen prices. In turn, lower prices can erode incentive for drilling, which eventually results in decreased production.
Severe Weather Can Disrupt Production
 Hurricanes and other severe weather can affect the supply of natural gas. For example, in the summer of 2005, hurricanes along the U.S. Gulf Coast caused the equivalent of about 4% of U.S. total production to be shut in between August 2005 and June 2006.
Imports Contribute to our Supply of Natural Gas
In 2011, U.S. pipeline imports amounted to almost 13% of total natural gas consumption. More than 99% of the pipeline-imported natural gas came from Canada, with the remainder from Mexico. U.S. pipeline imports are expected to decline in the future because of robust U.S. production.
Economic Growth Can Affect Natural Gas Demand and Prices
The strength of the economy is a major factor influencing natural gas markets. During periods of economic growth, the increased demand for goods and services from the commercial and industrial sectors generates an increase in natural gas demand. This is particularly true in the industrial sector, which is the leading consumer of natural gas as both a plant fuel and as a feedstock for many products such as fertilizer and pharmaceuticals. The increased demand can lead to increased production, and, in general, higher prices. Declining or weak economic growth tends to have the opposite effect.
Winter Weather Strongly Influences Residential and Commercial Demand
During cold months, residential and commercial end users consume natural gas for heating, which places upward pressure on prices as demand increases. If unexpected or severe weather occurs, the effect on prices intensifies because supply is often unable to react quickly to the short-term increased level of demand. These effects of weather on natural gas prices may be exacerbated if the natural gas transportation system is already operating at full capacity. Under these conditions, prices tend to increase, which reduces overall demand for natural gas and brings the market into balance. Natural gas supplies that were placed in storage during periods of lesser demand may be used to cushion the impact of high demand during cold weather.
Hot Summer Weather Can Increase Power Plant Demand for Gas
Temperatures also can have an effect on prices in the cooling, season as many electric power plants that are operated to meet air-conditioning needs in the summer are fueled by natural gas. Hotter-than-normal temperatures can increase natural gas demand and push up prices.
Natural Gas Supplies Held in Storage Play a Key Role in Meeting Peak Demand
The overall supply picture is also influenced by the level of gas held in underground storage fields. Natural gas in storage is a critical supply component during the heating season that helps satisfy sudden shifts in supply and demand, accommodates stable production rates, and supports pipeline operations and hub services. Levels of natural gas in storage typically increase during the refill season (April through October), when demand for natural gas is low, and decrease during the heating season (November through March), when space heating demand for natural gas is high. Natural gas in storage represents an incremental source of supply immediately available to the market. This can counteract the effects of sudden increases in demand for natural gas or supply disruptions such as pipeline outages that cause demand to exceed supply and thus lead to higher prices.
Competition With Other Fuels Can Influence Natural Gas Prices
Large-volume gas consumers (primarily industrial consumers and electricity generators) can switch between natural gas, coal, and oil, depending on the prices of each fuel. Because of the interrelationship between these fuel markets, when prices of the other fuels fall, any resultant shift in demand from natural gas to coal or oil reduces gas demand and pulls gas prices downward. When prices of the competing fuels rise relative to natural gas prices, there may be switching from the competing fuels to natural gas, increasing the demand for natural gas and pushing gas prices upward.
Although most of the switching occurs between natural gas and oil, natural gas and coal markets can also interact when the price of natural gas falls significantly. Electricity generation using natural gas can become attractive relative to coal-fired electricity generation in some areas of the country when the price of gas on an energy equivalent basis becomes less than the price of coal.
Read More
Factors on the supply side that may affect prices include:
- Variations in the amount of natural gas being produced
- The volume of gas being imported and/or exported
- The amount of gas in storage facilities (referred to as storage levels)
Factors on the demand side that may affect prices include:
- The level of economic growth
- Variations in winter and summer weather
- Oil prices
Domestic Supply and Prices Can Be Cyclical
Most of the natural gas consumed in the United States comes from domestic production. U.S. production increased from 2006 through 2011, when it reached the highest recorded annual total since 1973. The increases in production were the result of more efficient, cost-effective drilling techniques, notably in the production of natural gas from shale formations.
Increased natural gas supply tends to dampen prices. In turn, lower prices can erode incentive for drilling, which eventually results in decreased production.
Severe Weather Can Disrupt Production
Hurricanes and other severe weather can affect the supply of natural gas. For example, in the summer of 2005, hurricanes along the U.S. Gulf Coast caused the equivalent of about 4% of U.S. total production to be shut in between August 2005 and June 2006.Imports Contribute to our Supply of Natural Gas
In 2011, U.S. pipeline imports amounted to almost 13% of total natural gas consumption. More than 99% of the pipeline-imported natural gas came from Canada, with the remainder from Mexico. U.S. pipeline imports are expected to decline in the future because of robust U.S. production.
Economic Growth Can Affect Natural Gas Demand and Prices
The strength of the economy is a major factor influencing natural gas markets. During periods of economic growth, the increased demand for goods and services from the commercial and industrial sectors generates an increase in natural gas demand. This is particularly true in the industrial sector, which is the leading consumer of natural gas as both a plant fuel and as a feedstock for many products such as fertilizer and pharmaceuticals. The increased demand can lead to increased production, and, in general, higher prices. Declining or weak economic growth tends to have the opposite effect.
Winter Weather Strongly Influences Residential and Commercial Demand
During cold months, residential and commercial end users consume natural gas for heating, which places upward pressure on prices as demand increases. If unexpected or severe weather occurs, the effect on prices intensifies because supply is often unable to react quickly to the short-term increased level of demand. These effects of weather on natural gas prices may be exacerbated if the natural gas transportation system is already operating at full capacity. Under these conditions, prices tend to increase, which reduces overall demand for natural gas and brings the market into balance. Natural gas supplies that were placed in storage during periods of lesser demand may be used to cushion the impact of high demand during cold weather.
Hot Summer Weather Can Increase Power Plant Demand for Gas
Temperatures also can have an effect on prices in the cooling, season as many electric power plants that are operated to meet air-conditioning needs in the summer are fueled by natural gas. Hotter-than-normal temperatures can increase natural gas demand and push up prices.
Natural Gas Supplies Held in Storage Play a Key Role in Meeting Peak Demand
The overall supply picture is also influenced by the level of gas held in underground storage fields. Natural gas in storage is a critical supply component during the heating season that helps satisfy sudden shifts in supply and demand, accommodates stable production rates, and supports pipeline operations and hub services. Levels of natural gas in storage typically increase during the refill season (April through October), when demand for natural gas is low, and decrease during the heating season (November through March), when space heating demand for natural gas is high. Natural gas in storage represents an incremental source of supply immediately available to the market. This can counteract the effects of sudden increases in demand for natural gas or supply disruptions such as pipeline outages that cause demand to exceed supply and thus lead to higher prices.
Competition With Other Fuels Can Influence Natural Gas Prices
Large-volume gas consumers (primarily industrial consumers and electricity generators) can switch between natural gas, coal, and oil, depending on the prices of each fuel. Because of the interrelationship between these fuel markets, when prices of the other fuels fall, any resultant shift in demand from natural gas to coal or oil reduces gas demand and pulls gas prices downward. When prices of the competing fuels rise relative to natural gas prices, there may be switching from the competing fuels to natural gas, increasing the demand for natural gas and pushing gas prices upward.
Although most of the switching occurs between natural gas and oil, natural gas and coal markets can also interact when the price of natural gas falls significantly. Electricity generation using natural gas can become attractive relative to coal-fired electricity generation in some areas of the country when the price of gas on an energy equivalent basis becomes less than the price of coal.
The price of natural gas
The price that residential consumers pay for natural gas has two main parts (all cost components include a number of taxes):

The low wellhead price in recent years reflects several market conditions: Although national average prices for residential natural gas have declined in recent years, the prices in individual states can differ greatly. These differences are related to a number of factors:
To help reduce their natural gas bills, residential customers can:
Additional state energy assistance and fuel fund programs may be available to help households pay energy bills during a winter emergency. To find out if you qualify for assistance in your state, contact your state public utility commission or your local gas company.
Read More

- Commodity costs — the cost of the natural gas itself, known as the wellhead cost.
- Transmission and distribution costs — the cost to move the natural gas by pipeline from where it is produced to the customer's local gas company, and to bring the natural gas from the local gas company to the customer's house. These transmission and distribution costs account for the difference between the price of natural gas at the wellhead and the price paid by residential customers.
The low wellhead price in recent years reflects several market conditions:
- Record levels of production due to the development of gas from shale formations (plays)
- Growth in supply exceeding growth in demand
- Few supply disruptions as a result of relatively calm hurricane seasons Residential prices also reflect market forces including:
- Pipeline constraints to high-demand areas, particularly in the Northeast
- Net producing regions tend to be geographically removed from net consuming regions
 Although national average prices for residential natural gas have declined in recent years, the prices in individual states can differ greatly. These differences are related to a number of factors:
- the market's proximity to the producing areas
- the number of pipelines in the state
- average consumption per residence receiving service
- transportation charges associated with delivery
- state regulations
- degree of competition
To help reduce their natural gas bills, residential customers can:
- Shop for lower-priced natural gas, if their state has customer choice programs. Find more information on the status of natural gas residential choice programs in each state.
- Participate in their local gas company's yearly budget plan to spread gas costs evenly throughout the year, thereby lessening the impact of higher prices.
- Check natural gas appliances and space-heating equipment for efficient operation.
- Obtain a home energy audit to identify ways to conserve energy.
- Reduce thermostat settings, especially when they are not at home.
Additional state energy assistance and fuel fund programs may be available to help households pay energy bills during a winter emergency. To find out if you qualify for assistance in your state, contact your state public utility commission or your local gas company.
Natural gas consumption in United States
Natural Gas Is a Major Energy Source for the United States
About 25% of energy used in the United States came from natural gas in 2011. The United States used 24.37 trillion cubic feet (Tcf) of natural gas in 2011.
How Natural Gas Is Used
Natural gas is used to produce steel, glass, paper, clothing, brick, electricity, and as an essential raw material for many common products. Some products that use natural gas as a raw material are: paints, fertilizer, plastics, antifreeze, dyes, photographic film, medicines, and explosives.
Slightly more than half of the homes in the United States use natural gas as their main heating fuel. Natural gas is also used in homes to fuel stoves, water heaters, clothes dryers, and other household appliances.
The major consumers of natural gas in the United States in 2011 included:
Natural gas is used throughout the United States, but the top natural gas consuming states in 2010 were:
Read More
About 25% of energy used in the United States came from natural gas in 2011. The United States used 24.37 trillion cubic feet (Tcf) of natural gas in 2011.
How Natural Gas Is Used
Natural gas is used to produce steel, glass, paper, clothing, brick, electricity, and as an essential raw material for many common products. Some products that use natural gas as a raw material are: paints, fertilizer, plastics, antifreeze, dyes, photographic film, medicines, and explosives.
Slightly more than half of the homes in the United States use natural gas as their main heating fuel. Natural gas is also used in homes to fuel stoves, water heaters, clothes dryers, and other household appliances.
The major consumers of natural gas in the United States in 2011 included:

- Electric power sector — 7.6 trillion cubic feet (Tcf)
- Industrial sector — 6.8 Tcf
- Residential sector — 4.7 Tcf
- Commercial sector — 3.2 Tcf
Natural gas is used throughout the United States, but the top natural gas consuming states in 2010 were:
- Texas
- California
- Louisiana
- New York
- Florida
- Illinois
Natural gas reserves in United States
Underground Reservoirs Hold Oil and Gas
A "reservoir" is a place where large volumes of methane, the major component of natural gas, can be trapped in the subsurface of the Earth at places where the right geological conditions occurred at the right times.
Reservoirs are made up of porous and permeable rocks that can hold significant amounts of oil and gas within their pore spaces.
What Are Proved Reserves?
Proved reserves of natural gas are estimated quantities that analyses of geological and engineering data have demonstrated to be economically recoverable in future years from known reservoirs.
Proved reserves are added each year with successful exploratory wells and as more is learned about fields where current wells are producing. For this reason those reserves constantly change and should not be considered a finite amount of resources available. Application of new technologies can convert categories of previously uneconomic natural gas resources into proved reserves. U.S. proved reserves of natural gas have increased in every year since 1999, a trend accelerated by shale gas drilling.
How Much Natural Gas Reserves Are in the United States?
 In 2010, U.S. natural gas proved reserves, estimated as "wet" gas which includes natural gas plant liquids, increased by 12% to 318 trillion cubic feet (Tcf). Major improvements in shale gas exploration and production technologies drove the increase in U.S. natural gas proved reserves.
What Are Undiscovered Technically Recoverable Resources?
In addition to proved natural gas reserves, there are large volumes of natural gas classified as undiscovered technically recoverable resources. Undiscovered technically recoverable resources are expected to exist because the geologic settings are favorable despite the relative uncertainty of their specific location. Undiscovered technically recoverable resources are also assumed to be producible over some time period using existing recovery technology.
Did You Know?
In 1821, William Hart dug the first well specifically to produce natural gas in the United States in the Village of Fredonia on the banks of Canadaway Creek in Chautauqua County, New York. It was 27 feet deep, excavated with shovels by hand, and its gas pipeline was hollowed-out logs sealed with tar and rags.
Read More
A "reservoir" is a place where large volumes of methane, the major component of natural gas, can be trapped in the subsurface of the Earth at places where the right geological conditions occurred at the right times.
Reservoirs are made up of porous and permeable rocks that can hold significant amounts of oil and gas within their pore spaces.
What Are Proved Reserves?
Proved reserves of natural gas are estimated quantities that analyses of geological and engineering data have demonstrated to be economically recoverable in future years from known reservoirs.
Proved reserves are added each year with successful exploratory wells and as more is learned about fields where current wells are producing. For this reason those reserves constantly change and should not be considered a finite amount of resources available. Application of new technologies can convert categories of previously uneconomic natural gas resources into proved reserves. U.S. proved reserves of natural gas have increased in every year since 1999, a trend accelerated by shale gas drilling.
How Much Natural Gas Reserves Are in the United States?
 In 2010, U.S. natural gas proved reserves, estimated as "wet" gas which includes natural gas plant liquids, increased by 12% to 318 trillion cubic feet (Tcf). Major improvements in shale gas exploration and production technologies drove the increase in U.S. natural gas proved reserves.
What Are Undiscovered Technically Recoverable Resources?
In addition to proved natural gas reserves, there are large volumes of natural gas classified as undiscovered technically recoverable resources. Undiscovered technically recoverable resources are expected to exist because the geologic settings are favorable despite the relative uncertainty of their specific location. Undiscovered technically recoverable resources are also assumed to be producible over some time period using existing recovery technology.
Did You Know?
In 1821, William Hart dug the first well specifically to produce natural gas in the United States in the Village of Fredonia on the banks of Canadaway Creek in Chautauqua County, New York. It was 27 feet deep, excavated with shovels by hand, and its gas pipeline was hollowed-out logs sealed with tar and rags.
Natural gas imports and exports
 The United States consumes more natural gas than it produces. While most of the natural gas consumed in the United States is produced domestically, imports from other countries are also an important source of supply. The United States is a "net importer" of natural gas, meaning that it imports more natural gas than it exports.
Reliance on natural gas imports has declined in recent years due to a surge in natural gas production, resulting from more efficient, cost-effective drilling techniques, notably in the production of natural gas from shale formations. Net imports (imports minus exports) of natural gas accounted for 8% of U.S. natural gas consumption in 2011, compared to the 2007 peak of 16%.
Natural gas can be transported in two ways:
- Via pipeline — Forty-eight natural gas pipelines, representing approximately 28 billion cubic feet per day of capacity, imports, and exports natural gas between the United States and Canada or Mexico.
- Via ship in the form of liquefied natural gas (LNG)
Pipeline Imports of Natural Gas are Mostly from Canada
In 2011, net pipeline imports totaled 1,670 billion cubic feet, or 7% of total natural gas consumption. The United States received almost 90% of its pipeline-imported natural gas from Canada with the remainder from Mexico.
The United States Imports a Small Amount of Liquefied Natural Gas (LNG)
In 2011, LNG imports totaled 349 billion cubic feet, or about 1% of total natural gas consumption. LNG imports from Egypt, Qatar, Trinidad and Tobago, and Yemen contributed about 90%of total LNG imports.
Most Natural Gas Exports Go to Canada and Mexico
Exports of natural gas peaked in 2011, largely due to expanded pipeline exports to Canada and Mexico. Canada accounted for 62% of pipeline natural gas exports, and Mexico accounted for 33%. U.S. exports of natural gas also include:
- Domestically produced natural gas shipped to Japan as LNG
- LNG originally imported to the United States that is "re-exported" to new destinations where prices are higher
Where our natural gas comes from
Most of the Natural Gas Consumed in the United States Comes from Domestic Production
Share of 2011 natural gas marketed production:
 Texas (29%)
Wyoming (9%)
Federal Offshore Gulf of Mexico (8%)
Louisiana (13%)
Oklahoma (8%)
In 2011, 90% of net imports came by pipeline, primarily from Canada, and 10% came by liquefied natural gas (LNG) tankers carrying gas from five different countries.
What is the Federal Offshore Gulf of Mexico?
Some natural gas and oil wells are drilled into the ocean floor in waters off the coast of the United States. States have jurisdiction over any natural resources within three nautical miles of their coastline, except for Texas and the west coast of Florida where state jurisdiction extends to nine nautical miles. The federal government retains ownership to resources past those limits. There are around 3,400 oil and gas production platforms in federal waters up to roughly 7,500 feet deep and up to 200 miles from shore. Most of them are in the Gulf of Mexico.
What Are Gas Shales?
 Shale is a very fine-grained sedimentary rock that is easily broken into thin, parallel layers. Shales can contain a large amount of natural gas, but it's not necessarily mobile. Extensive efforts such as horizontal drilling and creating artificial fractures in the rock are often needed to achieve satisfactory production rates.
Gas shale is one of a number of "unconventional" sources of natural gas; other unconventional sources of natural gas include natural gas produced from coalbeds and from "tight" (impermeable) sandstone or chalk formations.
Supplemental Gas Supplies
Supplemental gas supplies include blast furnace gas, refinery gas, propane-air mixtures, and synthetic natural gas (gas made from petroleum hydrocarbons or from coal). These supplemental supplies totaled 61 billion cubic feet (Bcf) in 2011. The largest single source of synthetic gas is the Great Plains Synfuels Plant in Beulah, North Dakota, where coal is converted to pipeline-quality gas.
Natural Gas Is Stored Underground
There were about 410 active underground storage fields (salt fields, aquifers, or depleted fields) in the United States during 2010. Natural gas is injected into these fields primarily during April through October and withdrawn primarily from November through March during the peak heating season. As of April 2012, the estimated capacity for peak working gas storage was 4,410 Billion cubic feet.
Read More
Share of 2011 natural gas marketed production:
 Texas (29%)
Wyoming (9%)
Federal Offshore Gulf of Mexico (8%)
Louisiana (13%)
Oklahoma (8%)
In 2011, 90% of net imports came by pipeline, primarily from Canada, and 10% came by liquefied natural gas (LNG) tankers carrying gas from five different countries.
What is the Federal Offshore Gulf of Mexico?
Some natural gas and oil wells are drilled into the ocean floor in waters off the coast of the United States. States have jurisdiction over any natural resources within three nautical miles of their coastline, except for Texas and the west coast of Florida where state jurisdiction extends to nine nautical miles. The federal government retains ownership to resources past those limits. There are around 3,400 oil and gas production platforms in federal waters up to roughly 7,500 feet deep and up to 200 miles from shore. Most of them are in the Gulf of Mexico.
What Are Gas Shales?
 Shale is a very fine-grained sedimentary rock that is easily broken into thin, parallel layers. Shales can contain a large amount of natural gas, but it's not necessarily mobile. Extensive efforts such as horizontal drilling and creating artificial fractures in the rock are often needed to achieve satisfactory production rates.
Gas shale is one of a number of "unconventional" sources of natural gas; other unconventional sources of natural gas include natural gas produced from coalbeds and from "tight" (impermeable) sandstone or chalk formations.
Supplemental Gas Supplies
Supplemental gas supplies include blast furnace gas, refinery gas, propane-air mixtures, and synthetic natural gas (gas made from petroleum hydrocarbons or from coal). These supplemental supplies totaled 61 billion cubic feet (Bcf) in 2011. The largest single source of synthetic gas is the Great Plains Synfuels Plant in Beulah, North Dakota, where coal is converted to pipeline-quality gas.
Natural Gas Is Stored Underground
There were about 410 active underground storage fields (salt fields, aquifers, or depleted fields) in the United States during 2010. Natural gas is injected into these fields primarily during April through October and withdrawn primarily from November through March during the peak heating season. As of April 2012, the estimated capacity for peak working gas storage was 4,410 Billion cubic feet.
Liquefied natural gas (LNG)
 Liquefied natural gas (LNG) is natural gas that has been cooled to about -260°F for shipment and/or storage as a liquid. The volume of the liquid is about 600 times smaller than in its gaseous form. In this compact form, natural gas can be shipped in special tankers to receiving terminals in the United States and other importing countries. At these terminals, the LNG is returned to a gaseous form and transported by pipeline to distribution companies, industrial consumers, and power plants.
Liquefying natural gas provides a means of moving it long distances where pipeline transport is not feasible, allowing access to natural gas from regions with vast production potential that are too distant from end-use markets to be connected by pipeline.
In 2011, LNG imports contributed about 1% of total natural gas consumption. LNG imports from Egypt, Qatar, Trinidad and Tobago, and Yemen contributed about 90% of total LNG imports.
Even though the United States is primarily an importer of liquefied natural gas (LNG), it is also an exporter. Sometimes LNG originally imported to the United States is "re-exported" to new destinations where prices are higher.
Natural gas pipelines
An intricate transportation system, made up of about 1.5 million miles of mainline and other pipelines, links production areas and natural gas markets. The U.S. natural gas transportation network delivered more than 24 trillion cubic feet of natural gas during 2010 to about 71 million customers.
Transporting natural gas from the production field to the consumer involves a series of steps, generally carried out in order:
How Did This Transmission and Distribution Network Become So Large?
 About 142,000 miles of the current 306,000 miles of the mainline natural gas transmission network were installed in the 1950s and 1960s as consumer demand for low-priced natural gas more than doubled following World War II. In fact, about half of the natural gas pipeline mileage currently installed in Texas and Louisiana, two of the largest natural gas production areas in the country, was constructed between 1950 and 1969. By the close of 1969, marketed natural gas production exceeded 20 trillion cubic feet for the first time.
A large portion of the 1.2 million miles of local distribution pipelines, which receive natural gas from the mainline transmission grid and deliver it to consumers, was also installed during the same period. However, the period of greatest local distribution pipeline growth has been more recent. In the 1990s, more than 225,000 miles of new local distribution lines were installed to provide service to the many new commercial facilities and housing developments that wanted access to natural gas supplies during that period of economic growth.
The demand for natural gas has grown in recent years in part because it is considered a relatively environmentally-friendly energy source. Its use as an electric power generation fuel also has grown steadily with a decline in the capital costs of producing electric power from natural gas as technology in the area has improved.
Natural gas prices, along with oil prices, increased substantially between 2003 and 2008. Higher prices gave natural gas producers the incentive to expand development of new natural gas fields. Consequently, new pipelines have been and are being built to link these new production sources to the existing mainline transmission network. Construction of new transmission and local distribution mainline pipeline mileage during the current decade, 2000-2009, is projected to surpass that of any other decade since the 1950s.
Read More

Transporting natural gas from the production field to the consumer involves a series of steps, generally carried out in order:
- Gathering systems, primarily made up of small-diameter, low-pressure pipelines, move raw natural gas from the wellhead to a natural gas processing plant or to an interconnection with a larger mainline pipeline.
- Processing plants separate natural gas liquids and impurities from the natural gas stream before the natural gas is delivered into a mainline transmission system.
- About 306,000 miles of wide-diameter, high-pressure interstate and intrastate transmission pipelines transport natural gas from the producing area to market areas. Compressor stations (or pumping stations), located strategically along the length of the pipeline network, keep the natural gas flowing forward along the pipeline system. More than 200 companies operate mainline transmission pipelines.
- Underground storage facilities, fashioned from depleted oil, natural gas, or aquifer reservoirs or salt caverns, are used to store natural gas as a seasonal backup supply. In 2007, about 125 natural gas storage operators managed roughly 400 active storage fields. When needed, this reserve is withdrawn to meet additional customer demand during peak usage periods. Aboveground liquefied natural gas storage facilities are also used for this purpose. More than 200 companies operate
- More than 1,300 local distribution companies deliver natural gas to end users through hundreds of thousands of miles of small-diameter service lines. Local distribution companies reduce the pressure of the natural gas received from the high-pressure mainline transmission system to a level that is acceptable for use in residences and commercial establishments.
How Did This Transmission and Distribution Network Become So Large?
 About 142,000 miles of the current 306,000 miles of the mainline natural gas transmission network were installed in the 1950s and 1960s as consumer demand for low-priced natural gas more than doubled following World War II. In fact, about half of the natural gas pipeline mileage currently installed in Texas and Louisiana, two of the largest natural gas production areas in the country, was constructed between 1950 and 1969. By the close of 1969, marketed natural gas production exceeded 20 trillion cubic feet for the first time.
A large portion of the 1.2 million miles of local distribution pipelines, which receive natural gas from the mainline transmission grid and deliver it to consumers, was also installed during the same period. However, the period of greatest local distribution pipeline growth has been more recent. In the 1990s, more than 225,000 miles of new local distribution lines were installed to provide service to the many new commercial facilities and housing developments that wanted access to natural gas supplies during that period of economic growth.
The demand for natural gas has grown in recent years in part because it is considered a relatively environmentally-friendly energy source. Its use as an electric power generation fuel also has grown steadily with a decline in the capital costs of producing electric power from natural gas as technology in the area has improved.
Natural gas prices, along with oil prices, increased substantially between 2003 and 2008. Higher prices gave natural gas producers the incentive to expand development of new natural gas fields. Consequently, new pipelines have been and are being built to link these new production sources to the existing mainline transmission network. Construction of new transmission and local distribution mainline pipeline mileage during the current decade, 2000-2009, is projected to surpass that of any other decade since the 1950s.
Delivery and storage of natural gas
Natural Gas Is Often Stored Before It Is Delivered
Natural gas is moved by pipelines from the producing fields to consumers. Because natural gas demand is greater in the winter, it is stored along the way in large underground storage systems, such as old oil and gas wells or caverns formed in old salt beds. The gas remains there until it is added back into the pipeline when people begin to use more gas, such as in the winter to heat homes.

When the gas gets to the communities where it will be used (usually through large pipelines), it flows into smaller pipelines called "mains." Very small lines, called "services," connect to the mains and go directly to homes or buildings where it will be used.
Natural Gas Can Also Be Stored and Transported as a Liquid

When chilled to very cold temperatures, approximately -260°F, natural gas changes into a liquid and can be stored in this form. Because it takes up only 1/600th of the space that it would in its gaseous state, liquefied natural gas (LNG) can be loaded onto tankers (large ships with several domed tanks) and moved across the ocean to other countries. When this LNG is received in the United States, it can be shipped by truck to be held in large chilled tanks close to users or turned back into gas when it's ready to put in the pipelines.
Read More
Natural gas is moved by pipelines from the producing fields to consumers. Because natural gas demand is greater in the winter, it is stored along the way in large underground storage systems, such as old oil and gas wells or caverns formed in old salt beds. The gas remains there until it is added back into the pipeline when people begin to use more gas, such as in the winter to heat homes.
When the gas gets to the communities where it will be used (usually through large pipelines), it flows into smaller pipelines called "mains." Very small lines, called "services," connect to the mains and go directly to homes or buildings where it will be used.
Natural Gas Can Also Be Stored and Transported as a Liquid
When chilled to very cold temperatures, approximately -260°F, natural gas changes into a liquid and can be stored in this form. Because it takes up only 1/600th of the space that it would in its gaseous state, liquefied natural gas (LNG) can be loaded onto tankers (large ships with several domed tanks) and moved across the ocean to other countries. When this LNG is received in the United States, it can be shipped by truck to be held in large chilled tanks close to users or turned back into gas when it's ready to put in the pipelines.
Formation and extrapolation of natural gas
How Was Natural Gas Formed?
How Do We Get Natural Gas?
 The search for natural gas begins with geologists, who study the structure and processes of the Earth. They locate the types of rock that are likely to contain gas and oil deposits.
Today, geologists' tools include seismic surveys that are used to find the right places to drill wells. Seismic surveys use echoes from a vibration source at the Earth’s surface (usually a vibrating pad under a truck built for this purpose) to collect information about the rocks beneath. Sometimes it is necessary to use small amounts of dynamite to provide the vibration that is needed.
Scientists and engineers explore a chosen area by studying rock samples from the earth and taking measurements. If the site seems promising, drilling begins. Some of these areas are on land but many are offshore, deep in the ocean. Once the gas is found, it flows up through the well to the surface of the ground and into large pipelines.
Some of the gases that are produced along with methane, such as butane and propane (also known as "by-products"), are separated and cleaned at a gas processing plant. The by-products, once removed, are used in a number of ways. For example, propane can be used for cooking on gas grills.
Natural gas withdrawn from a well may contain liquid hydrocarbons and nonhydrocarbon gases. This is called "wet" natural gas. The natural gas is separated from these components near the site of the well or at a natural gas processing plant. The gas is then considered "dry" and is sent through pipelines to a local distribution company, and, ultimately, to the consumer.
Dry natural gas is also known as consumer-grade natural gas. In addition to natural gas production, the U.S. gas supply is augmented by imports, withdrawals from storage, and by supplemental gaseous fuels.
Most of the natural gas consumed in the United States is produced in the United States. Some is imported from Canada and shipped to the United States in pipelines. A small amount of natural gas is shipped to the United States as liquefied natural gas (LNG).
We can also use machines called "digesters" that turn today's organic material (plants, animal wastes, etc.) into natural gas. This process replaces waiting for millions of years for the gas to form naturally.
Did You Know?
Because natural gas is colorless, odorless, and tasteless, mercaptan (a chemical that smells like sulfur) is added before distribution, to give it a distinct unpleasant odor (it smells like rotten eggs). This added smell serves as a safety device by allowing it to be detected in the atmosphere, in cases where leaks occur.
Read More

How Do We Get Natural Gas?
The search for natural gas begins with geologists, who study the structure and processes of the Earth. They locate the types of rock that are likely to contain gas and oil deposits.Today, geologists' tools include seismic surveys that are used to find the right places to drill wells. Seismic surveys use echoes from a vibration source at the Earth’s surface (usually a vibrating pad under a truck built for this purpose) to collect information about the rocks beneath. Sometimes it is necessary to use small amounts of dynamite to provide the vibration that is needed.
Scientists and engineers explore a chosen area by studying rock samples from the earth and taking measurements. If the site seems promising, drilling begins. Some of these areas are on land but many are offshore, deep in the ocean. Once the gas is found, it flows up through the well to the surface of the ground and into large pipelines.
Some of the gases that are produced along with methane, such as butane and propane (also known as "by-products"), are separated and cleaned at a gas processing plant. The by-products, once removed, are used in a number of ways. For example, propane can be used for cooking on gas grills.
Natural gas withdrawn from a well may contain liquid hydrocarbons and nonhydrocarbon gases. This is called "wet" natural gas. The natural gas is separated from these components near the site of the well or at a natural gas processing plant. The gas is then considered "dry" and is sent through pipelines to a local distribution company, and, ultimately, to the consumer.
Dry natural gas is also known as consumer-grade natural gas. In addition to natural gas production, the U.S. gas supply is augmented by imports, withdrawals from storage, and by supplemental gaseous fuels.
Most of the natural gas consumed in the United States is produced in the United States. Some is imported from Canada and shipped to the United States in pipelines. A small amount of natural gas is shipped to the United States as liquefied natural gas (LNG).
We can also use machines called "digesters" that turn today's organic material (plants, animal wastes, etc.) into natural gas. This process replaces waiting for millions of years for the gas to form naturally.
Did You Know?
Because natural gas is colorless, odorless, and tasteless, mercaptan (a chemical that smells like sulfur) is added before distribution, to give it a distinct unpleasant odor (it smells like rotten eggs). This added smell serves as a safety device by allowing it to be detected in the atmosphere, in cases where leaks occur.
Saturday, May 11, 2013
Anatomy of natural gas market in United States
Note: This article is extracted from the book: Book name, Author, Publisher, Year.
The United States natural gas market can be divided into following sub-regions:
Western Gas Region
MidWestern Gas Region
Eastern Gas Region
Texas and Gulf Gas Region
Southeast Gas Region
Read More
The United States natural gas market can be divided into following sub-regions:
Western Gas Region

- Electrical generators through out this entire region depend on natural gas as a primary fuel. In summers it is very hot, and natural gas is especially in demand then to provide electricity for air-conditioning.
- The major competing power source is hydroelectric power from the Pacific Northwest. As a result, precipitation and snowmelt can have a large effect on regional natural gas prices during peak demand periods.
- Most of region has mild winters.
- In the Western United States, the geography is dominated by the Rocky Mountains. The West Coast (Washington, Oregon, California) and parts of Arizona are heavily populated. However, most of the region has a sparse population. California is the biggest user of natural gas, and tradding commonly revolves around imports to the California market. These imports come from Canda and the Desert Southwest.
- Storage capacity is extremely limited. This can lead to sharp price movements during the period of peak demand.
- Western basis prices are not highly correlated with the NYMEX futures (Henry Hub) since the region does not directly import from the Gulf Coast, where Henry Hub is located.
- A substantial amount of natural gas is produced at the eastern edge of the Rocky Mountains in Wyoming, Utah, and Colorado. However, most of this gas flows to the Midwest rather than to the population centers on the West Coast.
MidWestern Gas Region

- The Midwestern is a major consuming region during winter months. Cold winters characterize the entire Midwest region and there is a strong seasonal demand for natural gas in the winter to provide residential heating.
- This region does not use natural gas as a primary fuel for electrical power plants. Coal is the primary fuel for power in the Midwest. There is comparatively little demand for natural gas in the summer months.
- Numerous storage facilities and extensive local distribution networks are located in the region. Many of these areas have gonernment mandated obligations to meet residential demand during winter months. For example, to ensure that consumers have access to fuel, government might force gas in storage facilities to be delivered to residential consumers rather than saving it for commercial use.
- Large pipelines connect the Midwest to all of the major supply basins in North America. Canada and the Rocky Mountains supply the bulk of the Midwest's natural gas requirements. However, some gas also comes from the Gulf Coast region when it is available.
- Basis prices in the Midwest are somewhat correlated with NYMEX futures (Henry Hub). The region imports gas from the Golf Coast, but also has access to other gas supplies.
Eastern Gas Region

- On the East Coast, natural gas is used extensively for both residential heating and electrical generation. As a result, there is a year-around demand for natural gas in this region.
- There is a limited amount of storage available in the region. Combined with the high seasonal demand for both heating and electricity in the winter, basis prices (prices relative to the supply regions) are often the highest in the country.
- LNG (liquefied natural gas) terminals are being built to import gas from other countries and provide additional storage.
- The East Coast is a heavy importer of natural gas from Gulf Coast region. As a result, basis prices are highly correlated with NYMEX futures (Henry Hub).
Texas and Gulf Gas Region

- The Texas/Gulf Coast region is a net exporter of natural gas. It is the most important natural gas producing region in North America. Most of the exports flow to the East Coast and the industrialized Midwest.
- Abundant local supplies have made the region heavily dependent upon natural gas as a fuel for electricity generation.
- The region has mild winters, and there is a limited seasonal demand for natural gas during winter months for heating.
- There is a substantial amount of storage in the region. This helps processing plants located in the Gulf Coast region balance their production with consumer demand from other parts of the country.
- The basis prices in the region are highly correlated to NYMEX future prices. The settlement location for NYMEX futures, Henry Hub, is located in western Louisiana.
Southeast Gas Region

- Natural gas is primarily used to provide electricity in the Southeastern United States. The demand for electricity peaks during summer months as the hot summer create high demand for air conditioning.
- Mild winters limit the need for seasonal residential heating.
- The Southeast region has very limited or no storage capacity.
- LNG (liquefied natural gas) terminals are being constructed to supply additional natural gas and provide storage facilities. There is a major LNG terminal at Elba Island.
Overview of natural gas market
The natural gas market is one of the largest, most established energy markets.
Read More
- Natural gas plays a central role in the energy industry
- Cleaner burning than coal, less expensive than petroleum, limited carbon emissions, operational flexibility and efficiency.
- Almost all of fossil-fuel-based power plants built in USA since 1990 can burn natural gas ==> strong link between power and natural gas prices.
- It is prohibitively expensive to replace existing infrastructures of gas pipelines ==> Heating and electricity in North America highly depend on natural gas.
- Composition of natural gas
- Nonrenewable fossil fuel, colorless, odorless gas
- Primary composition: methane (CH4)
- Other contained hydrocarbons such as ethane (C2H6), propane (C3H8), and butane (C4H10)
- 'Dry' ==> Almost pure methane; 'Wet' ==> contains substantial amounts of other hydrocarbons.
- Trading unit of natural gas
- Natural gas is commonly traded in units of heat energy like British Thermal Units (BTUs), rather than in units of volume (like cubic feet)
- One cubic foot of dry natural gas contains approximately 1,000 BTUs
- 1 MMBTUs (million BTUs) = 1,000,000 BTUs ==> 1 BCF (billion cubic feet) natural gas contains about 1 million MMBTUs
- Natural gas are typically sold to consumers in units of therms. 1 therm = 100,000 BTUs = 0.1 MMBTUs
- Heat density
- One gallon (=0.13 cubic feet) gasoline contains 124,000BTU, the amount of heat contained in 100 cubic feet natural gas ==> 1 cf gasoline ~ 770 cf natural gas
- 1 cf gasoline ~ 3 cf natural gas (under 250 atmosphere pressure)
- 1 gallon gasoline ~ 1.5 gallon natural gas (supercooled liquid
- Transportation
- Natural gas is transported through pipelines, instead of pressurized container because it contains relatively low amount of energy per volume
- Natural can also be cooled to -260 F (liquefaction) to be transported in liquid form, suitable for the cases where building pipelines is impractical, such as transportation over oceans.
- Pipeline Transportation
- Hub --- the location where two or more pipelines connect
- Citygate --- a special type of hub where interstate pipelines connect to local distribution networks.
- Basis trading
- To trade natural gas, traders usually enter into two trades: (1) a futures trade at the Henry Hub; (2) a basis swap that exchanges the Henry Hub exposure for an exposure at some other location.
- Natural gas futures (Henry Hub contracts) are standardized, liquid, and traded at exchange
- Trading types
Since natural gas prices show strong seasonality, it is not common for traders to play directional bet on the entire natural gas market. Generally, traders speculate on one aspect of the natural gas market by entering into spread trades, where a trader benefits from the price difference between securities by buying one and selling another. - Location spreads: price difference between two locations
- Heat rates: speculate the relation between natural gas and electricity prices
- Time spreads: speculate on the price difference between periods of high and low demand
- Swing trades: traders use their gas storage capabilities to play the buy-low-sell-high games.
- Spot vs forward markets
- Natural gas spot prices are heavily influenced by weather
- Natural gas forward prices are seasonally cyclical
- The spot market is substantially more volatile than the forward market
- Natural gas futures prices are not linked to spot prices and carrying costs in the same way that the futures prices for stocks, bonds, and gold are linked to their spot prices.
Subscribe to:
Posts (Atom)


